Protecting Your Data Integrity with Stable Temperatures
Real-time temperature monitoring is one of those quiet tools that can make or break your science. When temperatures drift around your bench, even a little, your assays can look fine one week and fall apart the next. If you are working in a QC lab, a regulated research space, or any quality-focused lab, that kind of surprise is the last thing you want.
A big piece of the reproducibility problem in life sciences comes from small, hidden variables. Thermal variation is one of the sneakiest. You might have tight SOPs, well-trained staff, and qualified instruments, yet your data still wanders. Often the root cause is simple: the environment was not as stable as you thought.
Season changes make this worse. As we move from late summer heat into cooler fall weather, HVAC loads change, vents behave differently, and room air patterns shift. An experiment that was perfectly tuned in August may start drifting in October, even though nobody changed the protocol. Real-time monitoring gives you a way to see those shifts in the moment and protect both your data and your compliance.
How Thermal Drift Quietly Undermines Experimental Results
Thermal drift at the bench is not a dramatic freezer failure or an incubator alarm. It is the slow, quiet movement of temperature over time during an experiment, an incubation, or an instrument run. On paper, everything looks in range. In reality, the temperature might have crept up or down just enough to twist your results.
Here is what that can look like in practice when temperatures shift by only 1 to 2 °C:
- Enzyme kinetics change speed, so reaction curves shape-shift between runs
- Cell cultures experience stress, dropping viability or changing expression
- PCR efficiency swings, giving inconsistent Ct values and odd curve shapes
- Analytical instruments show drifting baselines that confuse data review
These changes are easy to blame on reagents, technique, or the instrument itself. But if you do not have continuous environmental data, you are often guessing. This is especially risky in GxP, GLP, CLIA, or ISO-accredited labs. Relying only on manual spot checks or old-style loggers you read at the end of the day leaves long gaps where thermal drift can hide.
You might see:
- Perfect morning runs but unstable afternoon data
- Method transfers that work in one lab but fail in another
- QC charts with strange spikes and no obvious explanation
Without real-time tracking, you have no clean way to prove whether environmental drift played a part.
Real-Time Temperature Monitoring as a Reproducibility Backbone
Real-time temperature monitoring means wireless sensors watching your space all the time, not just every few hours. The sensors send data to a central system that shows live trends, raises alerts, and stores audit-ready records. Instead of waiting until after a failed run to check conditions, you see what is happening while the experiment is in progress.
This kind of continuous oversight changes how teams respond. When you can see a small temperature climb early in an incubation, you can:
- Adjust an incubator before it drifts out of spec
- Move temperature-sensitive reagents away from a warm spot
- Shift a time-critical step to a more stable part of the day
You move from firefighting to prevention. That is where reproducibility starts to feel real, not just written in SOPs.
At Qualified Controls, we focus on more than just temperature. Many assays are sensitive to humidity and other environmental factors too. When you track these parameters together, you can correlate them with assay performance. Often, variability is not caused by a single factor, but by a mix of small shifts that only become clear when you see all the data on one screen.
Optimizing Sensor Placement at the Bench for Real Insight
Where you place sensors is just as important as having them. The air at bench height can be very different from what a wall thermostat shows. Vents, doors, windows, and heat-generating instruments all create tiny microclimates that your samples feel but your building controls may not.
Some practical placement tips for common lab setups:
- Laminar flow hoods: Place sensors near the actual working area, not buried in a corner, to see what plates and tubes experience.
- Benchtop incubators and cold blocks: Add sensors close to the load, not just on the outside, to track real sample conditions through the run.
- Sample prep areas: Monitor near pipetting zones where plates sit out, especially if they are close to vents or open doors.
- Analytical instruments: Place sensors at the intake or nearby space where solvents, standards, and samples rest before and after runs.
- Reagent and consumable storage: Watch shelves and cabinets that hold temperature-sensitive items, not just the general room air.
Wireless systems give you a lot of freedom here. You can reposition sensors during method development or validation to map temperature gradients across your bench. When you see where hot and cold spots really live, you can standardize bench layouts and sample positions so workflows are more repeatable day after day.
Correlating Temperature Data to Assay Outcomes for Root Cause Clarity
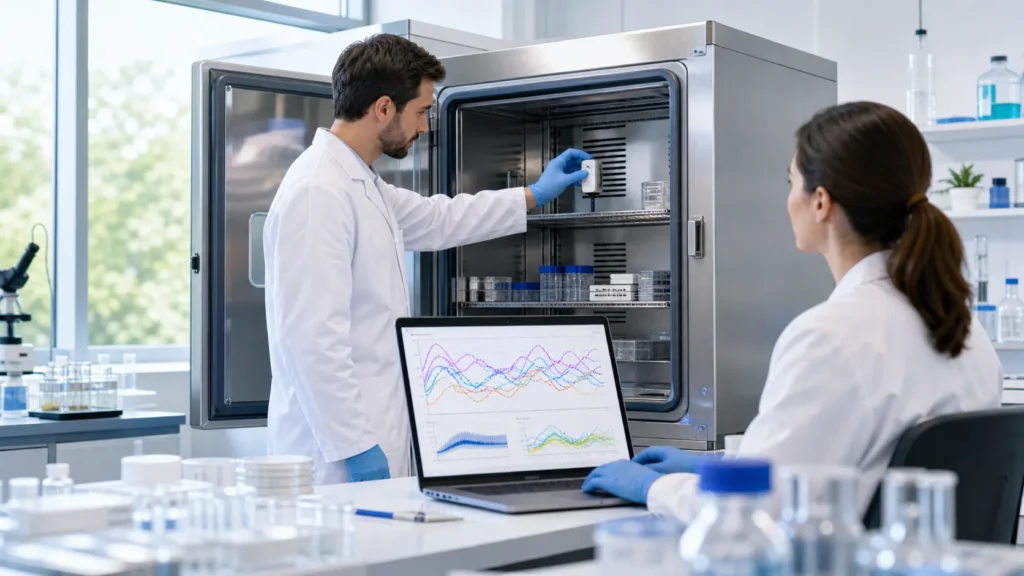
Real-time data turns into real insight when you line it up with what happened in the assay. Time-stamped temperature records can be matched to plate setup, incubation times, instrument runs, and readouts. When a batch looks off, you can ask a sharper question: what did the environment look like minute by minute?
For example, you might notice:
- Edge effects in microplates that match a small temperature difference near one side of a hood
- Calibration checks drifting at the same time each day when room temperature bumps up during a busy shift change
- A pattern where nonconformances spike after lunch when sun hits one side of the building
With integrated software, you can overlay temperature and humidity traces on QC charts, batch records, or LIMS timelines. During an investigation or CAPA, this makes it much easier to see if environmental drift is a true root cause or just background noise. You spend less time guessing and more time fixing.
At Qualified Controls, we design our approach to make this kind of correlation simple, not a data-wrangling project. Clear visuals and export options help quality, operations, and scientific teams look at the same story from different angles.
Turning Continuous Monitoring Into a Reproducibility Strategy
Treating real-time temperature monitoring as core lab infrastructure changes the way you think about reproducibility. It stops being just a data logging task for audits and becomes a daily tool for protecting experiments, transfers, and validations, especially as seasonal transitions put extra stress on HVAC systems and lab spaces.
A smart way to start is to:
- Do a bench-level environmental risk review and list the workflows most sensitive to temperature
- Flag zones where seasonal swings or daily traffic are likely to cause drift
- Pilot a wireless monitoring setup in a few critical areas to build your own internal evidence of value
At Qualified Controls, we focus on helping labs build wireless monitoring systems that actually match how they work, from sensors and layout to software and alerting logic. When your environmental data is clear, continuous, and easy to use, it supports reproducible science, protects your most important results, and keeps you ready for whatever the next audit brings.
Protect Your Inventory With Real-Time Temperature Insight
If you are ready to reduce product loss and gain full visibility into your warehouse conditions, we can help you implement reliable real-time temperature monitoring tailored to your operation. Our team at Qualified Controls will work with you to identify critical zones, set intelligent alerts, and streamline your compliance reporting. Take the next step toward tighter quality control and more predictable operations by reaching out to our experts today.