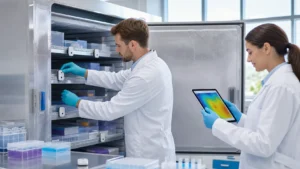
Freezer temperature mapping for ultra-low storage is about keeping your coldest freezers honest. When you are holding biologics, cell lines, vaccines, or long-term stability samples, you cannot just trust the display on the door. You need to know what is happening in every corner of that chamber, from the top shelf to the back of the bottom rack. That is exactly what a smart mapping study gives you.
In this article, we walk through how to design and run freezer temperature mapping for ultra-low storage, why regulators care so much about it, and how to turn one-time studies into ongoing monitoring that actually protects your samples. Our goal is to help you treat mapping as a strategic quality tool, not just a checkbox before an audit season or winter cold-chain pressure hits.
Protecting Ultra-Low Samples with Smart Temperature Mapping
Ultra-low temperature freezers usually run around -70 to -86 degrees Celsius. At those levels, a few degrees of difference can change long-term stability or damage sensitive materials. The freezer might look fine from the outside, but inside you may have hot spots, cold spots, and slow recovery areas that put critical work at risk.
A well-designed freezer temperature mapping study helps you:
- Find hot and cold spots before they cost you samples
- Prove that storage conditions meet protocols and labels
- Build science-based alarm limits and monitoring points
When mapping is treated as a quality investment, not just a task, it reduces the chance of temperature excursions, product loss, and hard questions during inspections. Done early and done well, it also gives you confidence going into colder months when power events, deliveries, and audit schedules tend to stack up.
Regulatory Expectations Driving Freezer Mapping Strategy
Regulators like FDA, EMA, and WHO expect environmental qualification for cold storage, including ultra-low freezers. Guidance built on GxP principles often breaks this into three stages: Installation Qualification, Operational Qualification, and Performance Qualification. Freezer temperature mapping sits in OQ and PQ, where you prove that the unit works as intended under real conditions.
Common inspector questions include things like:
- How did you design your mapping study and why?
- How often do you repeat mapping for each freezer?
- Which locations did you flag as worst case and how do you monitor them?
Inspectors also pay close attention to data integrity. That means they want records that meet ALCOA+ principles: data that is attributable, legible, contemporaneous, original, accurate, and backed by secure systems. When you have consistent, validated mapping data across sites, you are not scrambling to explain gaps or one-off methods at each location.
Planning a Risk-Based Freezer Temperature Mapping Study
Good mapping starts before you place a single sensor. You begin with a User Requirements Specification, or URS, for each ultra-low freezer. That URS defines what you expect from the unit, including:
- Operating range and setpoint
- Typical and worst-case loading patterns
- Door-opening schedules and workflow
- Backup power or CO2/LN2 support expectations
Next comes risk assessment. We look at which freezers hold the most critical or irreplaceable samples, which units see heavy traffic, and which are aging or known to be less stable. We also consider where the freezer sits in the building, since a unit in a warm hallway behaves differently than one in a climate-controlled lab.
Mapping strategy should fit those risks. That includes decisions about:
- Number of sensors and placement in a 3D grid
- Whether to map empty, partially loaded, and fully loaded conditions
- Seasonal mapping, such as summer and winter, to catch ambient extremes
- Alignment with HVAC performance and any known hot rooms or drafty areas
By matching mapping depth to risk, you put more effort where it protects the most.
Executing Ultra-Low Temperature Mapping Step by Step
Once the plan is set, execution becomes much smoother. Before you start recording data, you want to handle key pre-mapping tasks:
- Confirm calibration of probes and data loggers at the ultra-low range
- Verify correct time stamps and logging intervals
- Check freezer maintenance history and alarms
- Review defrost cycles or auto-clean functions so they do not surprise you mid-study
- Allow the freezer to reach steady-state conditions
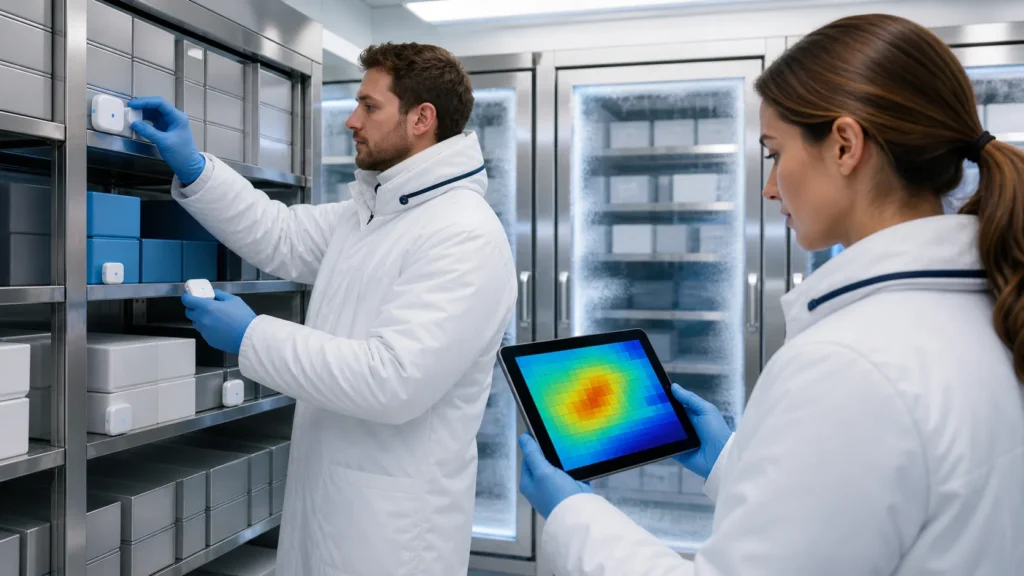
During the mapping run, we follow a clear layout. Sensors are placed in corners, center points, front and back, top and bottom, and any known risk areas, such as near the door. Data is logged at fixed intervals, often over 24 to 72 hours, so you can see both steady-state and stress conditions.
Stress testing often includes door-opening simulations that reflect real use, not perfect behavior. The goal is to understand temperature rise during openings and recovery times after closing. After the run, we review data to:
- Confirm uniformity around the setpoint
- Identify worst-case positions and slowest recovery points
- Compare results with acceptance criteria from the URS
- Document any deviations and record root causes and CAPA actions
Careful documentation here saves hours when an inspector wants to trace a single point from mapping to ongoing monitoring records.
From Mapping Results to Continuous Monitoring Intelligence
The most powerful use of freezer temperature mapping comes after the report is signed. Mapping tells you which probe locations are truly worst case. Those locations should guide where you place long-term monitoring sensors, not just where it is easy to mount them.
When you pair those probe positions with real-time monitoring, wireless sensors, and mobile alerts, mapping information does not sit in a binder. It drives:
- Smarter alarm setpoints based on proven behavior
- Faster detection of performance drift, like slow recovery times
- Better use of backup freezers and transfer workflows
Validated software and automated reporting make it easier to trend data over time and to answer inspection questions with a few clicks. Instead of searching for paper charts, you can show a clear story from mapping to daily monitoring and back again.
Turning Freezer Mapping Into a Repeatable, Digital Process
Ultra-low freezer qualification is not a one-time event. It should follow a lifecycle, with requalification after major maintenance, relocation, or changes in use. Many teams also build in a repeat schedule or seasonal checks, especially in places with hot summers or sharp winter swings.
Standardized, digital templates help here. When protocols, data capture, and reports share a common format, you:
- Cut down on human error and missing steps
- Shorten project timelines for new or replacement units
- Keep multi-site programs aligned, even when teams change
At Qualified Controls, we focus on automated monitoring and compliant data management that keep mapping, daily monitoring, and audit records tied together. That closed loop makes ultra-low storage easier to manage across sites, even as demands grow or regulatory attention increases.
Build a Future-Proof Ultra-Low Storage Program Today
This is a good time to look at your freezer temperature mapping and monitoring program with fresh eyes. Before winter stress hits, many teams benefit from checking whether mapping protocols are up to date, worst-case locations are still monitored, and requalification plans fit current risk.
A practical approach is to start with a risk-based review, prioritize your most critical ultra-low assets, and make sure mapping results drive how you monitor, alarm, and handle CAPA. At Qualified Controls, we work with regulated teams to design, run, and support freezer temperature mapping and real-time monitoring so ultra-low storage can keep pace with science and inspection needs.
Protect Your Cold Storage With Proven Temperature Mapping Expertise
If you are ready to verify that your frozen inventory is protected end to end, we can help you plan and execute a compliant freezer temperature mapping study tailored to your facility. Our team at Qualified Controls works with you to identify risk areas, define a practical mapping strategy, and interpret results so you can take clear action. Reach out to our specialists today to align your cold storage performance with regulatory expectations and your own quality standards.